
“Economics” is often used as a rhetorical weapon in political debates and commonly wielded against the Left. Former U.S. Rep. and House Speaker Paul Ryan once argued that the minimum wage was “bad economics.” In the U.K., MP Ed Miliband’s plans to freeze energy prices were branded “economically illiterate” by Margareta Pagano of The Independent. An actual exam question at the historically free market University of Chicago snarkily asked, “An economist at the University of Massachusetts-Amherst, Bernie’s favorite institution of ‘higher education’ [recently argued that] ‘we have a powerful weapon to fight inflation: price controls.’ How would a real economist respond?” Sometimes the charge of bad economics targets people on the opposite of the political spectrum. During the U.K. referendum to leave the EU, then U.K. Chancellor George Osborne referred to those in favor of Brexit as “economically illiterate.”
There is also a widespread notion that economics restricts the scope of policy discussion and that those who recommend policies outside this scope can safely be disregarded. The libertarian economist Thomas Sowell phrased it as “The first lesson of economics is scarcity: There is never enough of anything to satisfy all those who want it. The first lesson of politics is to disregard the first lesson of economics.” According to this interpretation, economics simply describes how the world works and if you don’t like it, then tough—anything you do to try to improve the situation will just fail or make things worse. Disregarding the inherent scarcity taught to us by economics is for reality-denying politicians who seek the common good. So goes the narrative.
Yet Sowell’s perspective is a gross misapplication of the field of economics. This idea of “economics” is based on a surface-level understanding of old introductory models that have since been contradicted by empirical evidence. The notion that economics confers hard limits on what we can and cannot do politically often draws from introductory or “Economics 101” classes. These classes center around the idea that free markets reach a happy equilibrium because they operate according to the laws of supply and demand. Government interventions into the free market are likely to backfire, according to this model.
Figure 1 shows the general form of demand and supply, with “price” on the y-axis and “quantity” on the x-axis. It’s best to think about this figure in terms of some commodity like “apples” or “iPhones.” For these kinds of things, the figure does capture important truths about commodities. Generally speaking, people will buy more of something if the price is lower and less if the price is higher. It is also true that if nobody wants something and there’s lots of it—or excess supply—the price will fall. But the problem comes when we move from these loose, general statements to scientific claims about which set of economic policies will work and which will not.

Before we start, I want to hit you with a few examples to think about:
- If people buy something, like a house or a share of stock, because they’re hoping to make money from it, will a price rise increase or reduce their demand?
- If a hairdresser has a lot of customers one day, will he raise the price or just have them form a queue? If this persists over the long term, will he raise prices or open new branches?
- The price of a piece of jewelry you liked the look of is surprisingly low. Do you now want it more, or less?
These are just examples which will (hopefully) inspire reflection, but in some cases the model has been clearly shown to be wrong when applied to policy, most notably in the case of labor markets. And despite what self-appointed economics experts on the internet may say, my claim that basic economics is not sufficient for policy analysis is not controversial within the discipline of economics. If I were to say in a labor economics seminar that “the most basic model we have fails to make sense of the evidence on policies like the minimum wage,” nobody would bat an eyelid. In fact, the point is so obvious it would scarcely be worth mentioning. Yet when “economics” travels into the political sphere it becomes more rigid and doctrinaire, often promoted by people with limited knowledge of the actual ideas they’re claiming to endorse (though sadly, also by people who should know better, as we’ll see). Over the past few decades, it has been shown that the standard “econ 101” story is misleading at best and flatly contradicted by the evidence at worst. I will detail both the theory and evidence in this debate to give people an idea of the shaky ground “basic economics” finds itself on.

Demand and Supply
Before we go into why demand-supply analysis of the labor market is wrong, we’ll build up the theory to show how it predicts that the minimum wage will increase unemployment. We can start with the demand curve shown in Figure 2, which depicts the willingness of business to employ workers in the form of a relationship between wages and employment. Demand curves depict the number of workers businesses are willing to employ at a given wage. If the wage is high, the model assumes that businesses will not find it profitable to employ many workers. On the graph, if you travel right from W1 until you hit the demand curve, and then go down until you hit the x-axis, you will get to E1, the corresponding level of employment at this wage. On the other hand, if the wage is lower, at W2, then businesses will employ more workers and employment will be at E2. Generally speaking, the lower the wage, the more workers businesses will want: “the demand curve slopes downwards” (from left to right) is an expression considered beyond reproach by many economists, as we shall see.

Similarly, the supply curve in Figure 3 shows the amount of labor workers are willing to supply for a wage. “Supplying labor” is a strange way of putting it that might not come naturally to most people, but the important thing to know is that if the wage is higher, more people will want to work. So if the wage is high at W1, employment will be high—at E3. If the wage is low at W2, employment will be low—at E4. As you can see, the supply curve slopes upwards (from left to right). Supply curves depict the amount workers are willing to work at a given wage.

Figure 4 shows what happens when the curves intersect each other: the decisions of the businesses balance with the decisions of the workers, and we get the outcome of wages W* and employment E*—what economists call an “equilibrium.”

Figure 5 (we are moving through them fast, so give yourself a chance to digest them if they’re new) shows how the minimum wage affects this happy depiction of the labor market. The minimum wage is represented by the line MW, which fixes the market wage. Where MW crosses the demand curve shows how much labor businesses will hire at the minimum wage. Where MW crosses the supply curve shows how much workers will want to work at MW. More people will want to work because MW crosses the supply curve much further to the right, at a higher level of employment E*S, but businesses are not willing to employ so many workers at such a high wage. At the minimum wage, businesses will only want to employ the number of workers EMW. Therefore, the employment level EMW will be the one that is realized, and it’s lower than the previous equilibrium E*.

Thus, the graphs prove that the minimum wage has reduced employment! Thomas Sowell was right! Riffing on the above, the libertarian economist Milton Friedman once described the minimum wage as “about as clear a case as one can find of a measure the effects of which are precisely the opposite of those intended by the men of good will who support it.”
But be careful. It is important to remember that this is a prediction of the model, not some kind of logically necessary truth about the real world. And I don’t think most non economists are aware of quite how convincing the empirical evidence against standard theory has been on this issue.

The Minimum Wage Debate
Last year, U.S. President Joe Biden promised to introduce a $15 federal minimum wage once elected, which sparked a renewed debate over the pros and cons of the policy. In a seeming victory for econ101-ism, the proposal was eventually voted down in the Senate. One study which probably contributed to this outcome was carried out by the Congressional Budget Office (CBO), an official but “non-partisan” entity which produces research on important policy topics.
Their 2021 report claimed that raising the minimum wage to $15 would lead to a reduction in employment by 1.4 million, a concerning figure.
To understand where figures like this come from, we need to take a deeper look at the literature on the minimum wage.

Source: The Rise of American Minimum Wages, 1912-1968. Fishback and Seltzer. (2021)
As you can see in the graph above, taken from Fishback and Seltzer (2021), in recent decades the U.S. federal minimum wage has stagnated or even fallen in real terms (the orange line). In the early 1980s, it was around $3 an hour, and despite steady rises in the nominal value (the blue line), it has only just kept pace with inflation since then. The U.S. lags behind other rich countries—and even many poorer ones—with its low minimum wage. As the table below shows, the ratio of minimum to median wages is only 33 percent for the U.S., compared to 54 percent for my own country (the U.K.) or 69 percent for Chile and Costa Rica. Some estimates state that a minimum wage of $13.34, or around 60 percent of the median wage, would be enough to keep a single earner with a family of four above the poverty line.

Source: Organisation for Economic Co-operation and Development.
The debate is therefore relevant to a broad range of countries. In the U.K. we have had the living wage campaign, which used social pressure to force companies to increase their wages and eventually made its way into policy for those age 25 and over, while Global Living Wage initiative has broadened the campaign to the world as a whole.
A crucial term in this debate is “elasticity.” In economics this means the percent change in one thing due to a one percent change in another thing. Here it will mean the change in employment owing to a change in the minimum wage. So, an elasticity of -1 means that if the minimum wage increases by 1 percent, employment will fall by 1 percent. An elasticity of -0.1 means that if the minimum wage increases by 1 percent, employment will fall by 0.1 percent.
You can see that the former (an elasticity of -1) would be hugely problematic because an increase of 10 percent in the minimum wage would lead to 10 percent lower employment. However, in the latter case (elasticity of -0.1), a 10 percent increase in the minimum wage would cause the fall in employment to only be 1 percent (10 multiplied by 0.1 equals 1), which could be considered a price worth paying for higher wages.
For a long time, economists have accepted the idea that the minimum wage would be bad for employment based on the supply and demand theory we’ve seen. Other justifications for this idea included what are now seen as relatively crude tests that today are not considered credible, even by opponents of the minimum wage. These crude tests are not worth going into here, but the studies which debunked them used methods which remain popular in empirical economics. Beginning with a famous paper by David Card and Alan B. Krueger in 1994, a wave of studies sometimes dubbed the “new minimum wage research” have used careful empirical techniques to investigate the elasticity of employment with respect to minimum wage changes. Card and Krueger looked at the effect of a minimum wage change using two adjacent U.S. states, New Jersey and Pennsylvania. In 1992, New Jersey increased its minimum wage while Pennsylvania did not.
This is what economists call a “natural experiment,” when a policy applied to one area is not applied to a similar area, and comparisons between the two approximate the ideal of a lab experiment. The argument goes that if the two areas differ only in the policy (in this case, the minimum wage) any difference in outcomes between them (in this case, employment) can be attributed to that policy. (Since the U.S. has many state-level policies, it’s fertile ground for these natural experiments.) Card and Krueger phoned fast-food restaurants, which employ a lot of minimum wage workers, both before and after the change, to survey them about their employment statistics. What they found was that far from reducing employment in New Jersey, the minimum wage actually may have increased it.
Naturally, the study made quite an impact. Reed Garfield, Senior Economist of the Joint Economic Committee, commented in 1996:
“The results of the study were extraordinary. Card and Krueger seemed to have discovered a refutation of the law of demand. Economists were stunned. Because of these extraordinary results, they debated the results. Many economists argued that differences [between the states] … were more than simply differences of minimum wage rates. Other economists argued that the study design was flawed.”
Since this, thousands of papers have been written in the U.S. and elsewhere on the employment effects of the minimum wage. One of the most pertinent critiques of Card and Krueger was how narrow their study was: a small change in the minimum wage at fast food restaurants in two relatively small U.S. states might not be applicable to minimum wages everywhere.
More recently, the frontier of minimum wage research has been led by people like Arin Dube and his coauthors. They have mostly followed in Card and Krueger’s footsteps by taking advantage of natural experiments but have substantially broadened the number of states they include, as well as the time frames of the studies, and the depth they go into when estimating the effects. For example, in a 2010 paper, Dube, Lester and Reich found no employment effects of the minimum wage using 316 adjacent pairs of states. A 2019 paper by Cengiz, Dube, Lindner, and Zipperer estimated the effect of minimum wages on the entire distribution of jobs, using 138 different minimum wage changes in the U.S., as shown on the below figure:

Source: The Effect of Minimum Wages on Low-Wage Jobs. Cengiz et al. (2019)
The x-axis shows the part of the wage distribution we’re in, relative to the minimum. “2” means it’s $2 higher than the new minimum wage. The y-axis shows the effect on employment at a given part of the wage distribution. Just below the minimum wage—0 on the x-axis—a substantial number of jobs disappear, as shown by the negative blue bar, which makes sense as it’s now illegal to employ people at that wage. But this is offset entirely by the appearance of jobs at or above the new minimum wage, as shown by the positive blue bar to its right. There are no effects anywhere else in the distribution, so this gain in wages for low-income workers is not offset by other workers losing out. The same paper looks at these effects over the long-term and shows that the new jobs which appear do not disappear after a few years.
I favor this type of natural experiment approach. It’s transparent, and the core of close comparison between pairs of real regions keeps the method grounded in empirical reality, instead of blinding us with complex statistical methods. But there are dissenters within this literature, specifically economists like David Neumark and his coauthors. Their research generally uses an approach which compares entire states in order to control for things that are different between states, assuming these things don’t change. One issue with this is that states may experience changes (e.g., economic booms) which are associated with changes in minimum wage policies, and this will confound the estimation. The approach of Card and Krueger, Dube, and others uses close comparisons of counties which are likely to be experiencing similar trends and so better account for things like economic booms.1

Making Sense of the Minimum Wage
Overall, systematic meta-analyses have found a small but statistically significant negative elasticity of employment with respect to minimum wage changes, but also that there is a bias toward publishing negative estimates. The below figure from Doucouliagos and Stanley (2009) shows a meta-analysis of minimum wage effects from 2009. On the x-axis is the elasticity—that is, the response of employment to the minimum wage. On the y-axis is a measure of the statistical precision: the higher the number, the more precise the estimate.

Source: Publication Selection Bias in Minimum-Wage Research? A Meta-Regression Analysis. Doucouliagos and Stanley. (2009)
We can notice a few things about this plot:
- The majority of estimates are very close to zero, that is, suggestive of a small effect.
- The estimates closer to zero are generally higher on the figure, which means they are estimated more precisely. This suggests that the 0 estimates are the more credible ones.
- If you look closely, there is an asymmetry, with more estimates on the negative side of 0 than on the positive side. You may think this is evidence in favor of a negative effect, but actually—when combined with point (2)—it is potentially evidence of publication bias. Given the most precise effects center around 0, we’d expect an even distribution of both positive and negative effects around it, by chance. Doucouliagos and Stanley themselves report evidence of publication bias, loaded toward finding negative estimates of the minimum wage.
Surveying such a large and contested literature is a difficult task for sure, but the CBO’s report is not the way to go about it. Most of the work for their 2021 briefing was done in a 2019 report which is irredeemably opaque, full of phrases like “CBO concluded” and “in CBO’s estimation,” often with little to no explanation. They forego meta-analysis of all credible papers in favor of a subjective review of 11 selected studies. This can be justified—meta-analyses flatten a lot of what is interesting about individual studies—but the CBO are vague about why these 11 studies were chosen. They state:
“CBO’s review focused specifically on 11 studies that reported short-run employment elasticities for all or most directly affected workers (see Table A-2). The minimum-wage changes analyzed in most of those studies roughly reflected historical increases, but in several instances the changes analyzed were larger than average. For each of the 11 studies, CBO endeavored to identify the authors’ preferred estimate of the short-run employment elasticity for all directly affected workers, in several cases contacting the authors for clarification.”
Were one to read this without any knowledge of the minimum wage literature, one could be forgiven for thinking that only 11 studies in the literature actually “reported short-run employment elasticities for all or most directly affected workers” but this is untrue, or at least needs further justification. Arin Dube conducted a similar review of the evidence for the U.K. Treasury in the same year as the CBO report. He explicitly restricted his analysis to the “own-wage employment elasticity” (OWE), which tells us how employment for the specific group responds to an increase in the average wage of that group induced by the minimum wage change.” This is a similar criterion to the CBO, yet Dube finds 36 U.S. studies that report the OWE, not 11. In addition, he details the process of compiling his list, whereas the CBO doesn’t. This lack of transparency makes the CBO’s report feel incredibly untrustworthy.2

Returning to Dube’s 2019 review, his studies for the U.S. and U.K. together total 55, as shown in chart 4-B:

Source: Impacts of Minimum Wages: Review of the International Evidence. Dube, Arindrajit. (2019)
Along the y-axis is the study; the dots represent the estimated effect size for that study, with the bars either side of the dots representing the uncertainty surrounding that estimate. Dube concludes that based on this review, the average elasticity is -0.04, meaning that a 25 percent increase in average wages for a group affected by the minimum wage should reduce employment by 1 percent for that group. You might also notice the larger value of -0.17 on the figure, which includes estimates for subgroups more likely to be affected, such as teenagers. All in all, these effects are negative but small. Given various problems with publication bias (as noted earlier), statistical power, p-hacking, subjective decisions by researchers, noise, and misspecification which are likely endemic in quantitative social science (but too much to go into here), an effect size this small should basically be read as 0.
Of interest for the $15 debate are Dube’s comments on how high the minimum wage could be:
“Across US states, the best evidence suggests that the employment effects are small up to around 59% of the median wage. Evidence using sub-state county-level variation found this to hold even in lower wage counties where the minimum stood at up to 81% of the median wage. Research conducted for this report also finds that in the 7 US states with the highest minimum wage, where the minimum is binding for around 17% of the workforce, employment effects have been similarly modest.”
Is a $15 minimum wage justified based on the evidence cited here? Data from the Economic Policy Institute show that the current median wage in the U.S. is $19 per hour and, using the Dube quote, we can take 81 percent of this as unlikely to create unemployment problems, and that number is over $15. Factor in the gradual implementation of the policy over time (and the corresponding rise in the median wage itself), and I really doubt there are going to be noticeable effects on employment overall. It’s reasonable to worry about difficulties in low-wage states, but to be honest the evidence just doesn’t show that minimum wage increases anywhere—including other countries with high minimum wages, as noted by Dube—have had notable effects, so I’m not holding my breath for a catastrophe. Additionally, it is well known that labor’s share of national income has declined over the past few years. Had labor’s share stayed constant and had the minimum wage kept up with the median wage, by my calculations the current minimum wage would be around $25.
It should be acknowledged that the overall null effect of the minimum wage hides differences between industries and localities. There are cases where higher labor costs could be a deciding factor. For example, in industries where international competition is stiff and employers cannot raise prices nor benefit from higher domestic demand, the minimum wage seems to have a more predictable effect on unemployment. And evidently, there is some level of the minimum wage which would have adverse consequences for unemployment, not to mention other outcomes. Puerto Rico has a long history of suffering after federal changes in the minimum wage pushed wages well above average wages in a region that has historically had a weak formal labor market.
In practice, I would not be averse to a policy with some allowance for local variation. The minimum wage is a blunt tool, especially in a country as diverse as the U.S. Labor unions effectively achieve this localized variation in the Scandinavian countries, which do not have a legislated minimum wage. But some negative effects in specific cases are not evidence in favor of the standard theory, which predicts a universal impact on employment. My point is not that a $15 or even $10 minimum wage has absolutely no adverse effects, but that standard economic theory is not very helpful for understanding if and when it does.

Why Demand-Supply is Wrong
In 2000, the economist Thomas C. Leonard challenged the profession, pointing out that the minimum wage debate prompts the question, “What evidence would convince you that your theory is refuted?” The demand and supply model of the labor market creates a scenario in which an isolated increase in labor costs is noted to reduce the employment of the affected workers (see Figure 5 above). However, as the above evidence illustrates, this effect is small at best and quite possibly zero overall, with some studies even suggesting that it is positive. When effect sizes are this small and uncertain, this suggests that the effect is just not that interesting, theoretically or politically. Even the arguments I’m about to discuss have to concede that the theory is dealing in small magnitudes, which suggests to me that if we want to understand the key drivers of the labor market we should look elsewhere. (We could reverse the question and ask: if unemployment were the goal, would increasing the minimum wage to $15 be a good way to achieve it? The answer is obviously no).
A recent paper by Alan Manning starkly lays out the “elusive” relationship between minimum wages and unemployment. He uses seven different methods to estimate employment elasticities for 16- to 19-year-olds, the group most likely to be affected by the minimum wage policy. As you can see, in most cases the blue horizontal lines cross 0, which is given by the red vertical line, indicating that the effects estimated are not statistically distinguishable from none at all:
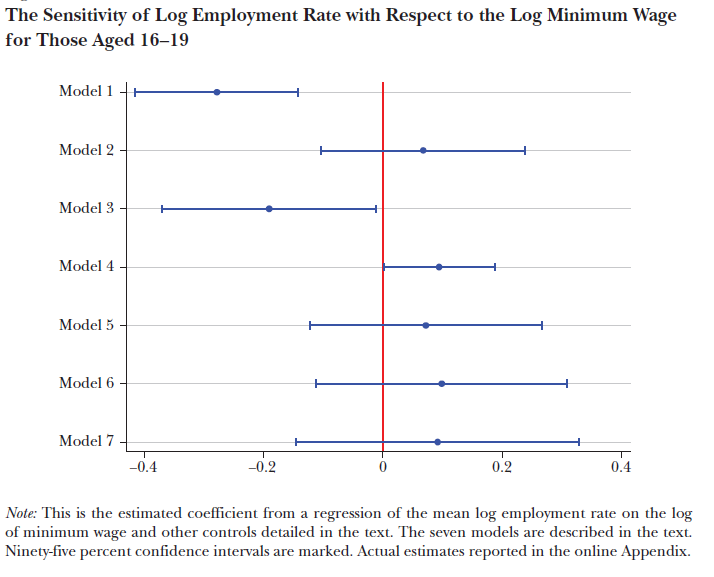
Source: The Elusive Employment Effect of the Minimum Wage. Manning, Alan. (2021)
As a contrast, consider a more straightforward question: what is the effect of the minimum wage on wages themselves? This might seem tautological, but if the minimum wage is low, or is not enforced, we may not observe an effect. Unlike the previous figure, the estimates in the figure below are universally positive and statistically distinct from zero. The point estimates indicate that the minimum wage increases wages by 17.5 percent to 27.5 percent, a sizable increase which nonetheless does not map reliably onto an effect on employment. It is difficult to square this with demand and supply because it shows that the key mechanism that drives its results is barely detectable. Card and Krueger found the same result in their original study and it seems to have held up.
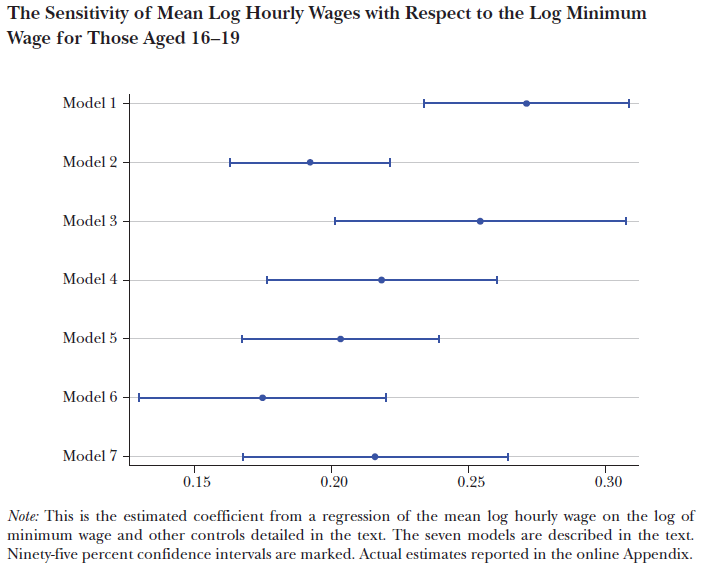
Source: The Elusive Employment Effect of the Minimum Wage. Manning, Alan. (2021)
As Manning details, there are numerous mechanisms that conflict with the standard theory: contrary to the perfectly competitive world depicted in the model, employers often have more bargaining power than workers, so they can afford the increase in wages without reducing employment. They may simply increase prices to cover the extra costs, which is possible when they have some degree of market power over consumers. There is evidence that increased pay can motivate workers, leading to higher productivity; or make them more likely to stay, reducing turnover costs from hiring and firing. And at the economy-wide level, the minimum wage increases the spending power of workers, which will increase demand for businesses. There’s so much going on in the labor market that isn’t depicted by demand and supply curves that they’re not a good guide to policy in the real world.
One counterargument I’ve seen is to say that this literature only looks at “small” changes in the minimum wage. But the modern literature has looked at plenty of large increases: city-level studies of the type summarized by Dube and Lindner (2021) provide the most direct evidence, since many cities have already increased their minimum wages to $15 or are in the process of doing so. Despite being a high level and a sizable rate of change in the minimum wage, the results show null to modest effects on employment. In my own country of the U.K., we went from a 0 minimum wage to $4.80 in 1998, and there were no detected effects on employment. Germany went from nothing to $8.50 and saw similar null effects.
In any case, the “small” point seems to misunderstand economics 101. In the demand-supply diagram in Figure 5, a binding minimum wage will reduce employment. It can be small and above the free market equilibrium, therefore reducing employment. Or it can be large and below the free market equilibrium, not reducing employment. It’s possible those who make this argument are confusing the test of the theory with advocacy for a particular minimum wage, something which has frustrated Card himself:
“What we were trying to do in our research was use the minimum wage as a lever to gain more understanding of how labor markets actually work and, in particular, to address a question that we thought was quite important: To what extent does the simplest model of supply and demand actually describe how employers operate in the labor market? That model says that if an employer wants to hire another worker, he or she can hire as many people as needed at the going wage. Also, workers move freely between firms and, as a result, individual employers have no discretion in the wages that they offer.
In contrast to that highly simplified theoretical model, there is a huge literature that has evolved in labor economics over the last 25 years, arguing that individuals have to spend time looking for job opportunities and employers have to spend time finding employees. In this alternative paradigm a range of wage offers co-exist in the market at any one time. That broader theory is, I think, pretty widely accepted in most branches of economics.”
Card’s quote leads us to an alternative counterargument, which is to say that the evidence actually points towards negative employment effects. Either Dube’s or Manning’s review can be interpreted to favor a very small but nonetheless negative elasticity of employment with respect to the minimum wage. A 2022 review by Neumark and Shirley took this further, stating “there is a clear preponderance of negative estimates in the literature.” Neumark and Shirley fall into several traps discussed above, since they conflate several different types of elasticities (rather than just comparing Own-Wage Elasticities, as Dube does) and they also do not account for publication bias (they try to justify this, but their reasons are unconvincing). In addition, when the paper was first released Dube had to inquire as to why several prominent studies were omitted, including Manning’s. The paper has been updated since then, but this follows in a long tradition Neumark seems to have of conducting seemingly subjective literature reviews, something also noticed by John Schmitt when evaluating Neumark and Wascher’s 2006 review which came to similar conclusions about the minimum wage.
In any case, let’s take opponents of the minimum wage at their word about the estimates in the literature and go back to the demand-supply model. Neumark and Shirley give a median of just under -0.1, which implies the demand curve for labor is “inelastic.” To understand what this means consider Figure 6, which shows demand-supply in the labor market when the demand curve is steeper than in the figures presented above. Because of how steep the demand curve is, the imposition of the minimum wage MW creates unemployment, but less than in Figure 4. If Neumark and co. are correct about the effect of the minimum wage on employment, then this is the correct model of the labor market, or at least of the low-wage labor market. It is worth saying that this interpretation does imply that relatively large changes in the minimum wage will have small effects on employment and therefore are not much to worry about. Opponents of the minimum wage arguing that labor demand is inelastic would therefore be what the kids refer to as a “self-own,” but let’s stick to evaluating the model itself.

It is important to note that believing labor demand is inelastic implies a specific view of labor markets, one which is not often justified independently of the minimum wage literature in these debates. It implies employers generally do not change employment much when wages change, which follows if labor is a small proportion of total costs; or if substituting labor for machines is hard; or if prices cannot be raised on consumers. None of these can be (or are) assumed as general properties of markets, and I’d like to see a justification for inelastic labor demand that isn’t purely motivated by the minimum wage findings. Adjusting key parameters of your theory after the fact is acceptable up to a point, but you need to test the implications of the new restrictions you’ve placed on the theory.
One major piece of evidence against inelastic labor demand curves for low wage workers comes from a debate which is even more politically, albeit less academically contentious: immigration. In the standard model an increase in the supply of something—say, laborers due to an influx of migrants—is represented by a rightward shift in the supply curve. You can see this in Figure 7 (yes, the figures are back!), where the increase in supply from S1 to S2 results in a rise in employment from E1* to E2*, but a fall in wages from W1* to W2*. If there are more workers, there’s more competition for jobs and wages will fall.

As with the minimum wage debate, this is a prediction of the theory which has had mixed support at best, with some studies suggesting that immigration has no effect on wages while other studies suggest the effect is small. In 1990, David Card (yes, the same one) famously published a paper on the influx of Cuban migrants in Florida following the Mariel boatlift in 1980, when Castro permitted over a hundred thousand Cubans to leave the island. Card found that despite this huge and unexpected (from the perspective of Miami) increase in the supply of labor, wages for low-wage workers in Miami didn’t budge when compared to other cities with similar characteristics.
As you’d expect, the paper did not go undisputed. Economist George J. Borjas argued in 2015 that Card’s evidence does not use the appropriate comparison groups. Instead of comparison with cities, Borjas uses comparison with groups of “similar” native workers. I will spend less time on this than on the minimum wage findings, partly because I’ve already discussed how these comparison methods work and partly because unlike the minimum wage literature, I think it’s fair to say that the consensus is clear here: Borjas is wrong. David Roodman pointed out that he chooses comparison groups with very small samples; excludes women for no good reason; and seems to attribute a gradual decline in wages in Miami to the Boatlift, even though wages show no noticeable jump in 1980-81 despite a 7 percent rise in labor supply following the event.
In an earlier article whose title tellingly contains the phrase “The Labor Demand Curve Is Downward Sloping,” Borjas looked at the effects of immigration more generally using what’s called a “skill cell” approach. This compares immigrants and natives with certain levels of education and/or experience. Education and experience are difficult to change quickly and therefore can be taken as fixed in the short-term, according to this method. He found large effects on wages and employment in U.S. data which are highest for low-skilled and for high-skilled immigrants, while those in the middle were least affected. Though this is an interesting result, the study does not use the natural experiment method pioneered by Card et al., so the causality is suspect. It could be that, for example, degree holders face broad changes (e.g., the rise of the tech sector) which drive their wages and employment as well as immigration policy.
In addition, Borjas makes a number of key assumptions which may drive his results. He assumes that the level of investment in the economy does not expand in response to new workers, which is only valid in the short-run. Expanding investment is a key way immigration may be good for everyone else in the long-run. Borjas also assumes that immigrants and natives take the same jobs, which is extremely unrealistic. Most obviously, natives may be more likely to take jobs that require more communication owing to different language skills, while immigrants do more manual labor. As Roodman puts it, immigrants may work in the kitchen while natives will work at the front of the restaurant.
One of the most innovative papers on the issue of whether immigrants and natives take different jobs was by Michael A. Clemens, who used a policy which tried to give priority to U.S. citizens in farm jobs traditionally given to immigrants. He found that even during the Great Recession and even with employers obliged to pursue them, native workers were unlikely to apply for these jobs. Ottaviano and Peri (2012) responded to Borjas’ 2003 paper but accounted for the fact that workers and immigrants take different jobs and found no effect of immigration on wages across the skill distribution. As with the minimum wage example, a flat out zero effect falsifies demand-supply on its own, since it implies one of the key mechanisms of the theory is not observed in practice.
As previously summarized by Roodman, most studies of immigration fail to find large impacts on native wages because the ‘labor market’ is actually highly complex and segmented. This is the most important point to come out of the immigration literature and goes back to Card’s quote above. There are many different things going on in labor markets, with important distinctions to be made between ‘high-skilled’ and ‘low-skilled’ labor, immigrants and natives, and between the short and long term. (Ironically for opponents of immigration, the group most likely to be affected by immigration seems to be previous immigrants.) Although demand-supply may capture a couple of loose intuitions within specific groups of workers, it cannot be used to draw out general conclusions regarding the effect of immigration on employment and wages.
To fully illustrate how this all contradicts demand and supply, let’s be generous to Borjas’ side and assume that the effect on wages is negative. The Cato institute’s Alan de Brauw assesses the low-wage elasticity of immigration in the U.S. at -0.2, so if the number of migrants increases by 10 percent then wages fall by 2 percent on average. This indicates that labor demand is highly “elastic”3, as illustrated in Figure 8, where the increase in supply from S1 to S2 does not result in much of a change in wages (W1* to W2*) because demand D1 is so elastic (flat). However, this completely contradicts the evidence for the minimum wage (even if this evidence is also generously interpreted from our side), which would indicate a steep demand curve, as shown in Figure 5. The demand curve cannot be both flat and steep! The theory just cannot make sense of the evidence.

The final riposte to this argument would be that immigration raises both demand and supply, and therefore both shift to the right and the effect on wages is ambiguous and the theory is saved. While this is surely true, it is stretching the theory beyond its intended use (it’s probably the case that higher minimum wages increase demand, too—try to put that on the diagram if you want a headache). Demand and supply is what’s known as a “partial equilibrium” theory, where we vary one component of the theory while holding the others constant. If we can move both the curves and also change their slope, then the theory can accommodate almost anything and becomes virtually unfalsifiable. We need to use broader theories to understand the effects of these policies. Again, this is something economists do plenty, but it is often lost in public discussions of ‘basic economics.’

The Brain Worm of Economics
Why is economics 101 so pervasive as a set of propositions? It’s kind of odd that an introductory diagram, based on obscenely unrealistic assumptions, would have so much influence. One argument is that it often seems to favor the rich and powerful, which isn’t a bad feature for a theory to have if its proponents want it to be accepted and enacted as policy (if you want to learn more about the political economy of these ideas, please watch Mexie’s segment in my original video on this subject).
But I also think there’s a more subtle force at play here. The reaction by Nobel Laureate James Buchanan to the Card-Krueger finding—that the minimum wage may actually increase employment—may give us a clue as to what is going on:
“Just as no physicist would claim that ‘water runs uphill,’ no self-respecting economist would claim that increases in the minimum wage increase employment. Such a claim, if seriously advanced, becomes equivalent to a denial that there is even minimal scientific content in economics, and that, in consequence, economists can do nothing but write as advocates for ideological interests.”
This statement reveals what’s at stake: not just what is actually a fairly minor concession to government regulation versus the free market, but the very idea of economics as a science, with general laws that cannot be violated. Buchanan is right. Accepting these findings does amount to a denial that economics has scientific content, because if markets do not obey supply and demand, then what hope is there?
Although Buchanan is obviously correct that ideas taught in physics 101, like “gravity makes things fall,” are pretty reliable, no self-respecting physicist or engineer would analyze the real world or design a plane using the introductory model with gravitational force but no friction or spin, not to mention promoting a view of physics with no considerations at the level of quantum mechanics or general relativity. Similarly, no economist, pundit, or policymaker should be recommending real world policies based on the Econ 101 model.
To reiterate, “econ 101” as used in political debate is distinct from the content of an actual Economics 101 course, especially in the modern day (unless you go to Chicago). There are numerous ways that the core model can fail. Taking economics 101—not to mention economics 102, or 403—is one of the better places to find out how the core supply and demand theory is not robust, with tweaks to its assumptions opening up the room for various policies. However, this clearly hasn’t stopped some economists from falling back on the basic theory as a default, thus contributing to misperceptions around economics.
Accepting that the introductory demand-supply model has limited relevance is the scientific thing to do. In contrast, doctrinaire and one-eyed statements about how an imagined “basic economics” implies we can’t have nice things are the height of ideology. Most policies have both positive and negative effects, and the degree to which one outweighs the other will depend on careful case-by-case consideration. Simplistic deference to watered down versions of econ 101 can only be bad for this process and, in the end, mostly serve as a bulwark for bad ideas.
Another method that’s been used by Neumark and others is a “synthetic control” where, rather than using neighboring states, you construct a comparison as a statistical combination of selected states to try to best mimic the state where the policy changed. However, this is an opaque method that has a lot of room for tweaking to get the results you want. As Daniel Kuehn has summarized, in the minimum wage debate, synthetic controls have been used to show either an effect on employment or no effect on employment, which varies with the authors, and I just don’t trust the approach. ↩
The issues with the CBO’s report do not stop there, since they have a strange way of computing the “average” of their chosen study. The median elasticity from Table A-2 is –0.20, but they are not happy with this:
“Although CBO’s median estimate was informed by the results from the 11 most applicable studies, the information they provide about that median is uncertain, and the agency’s estimate reflects consideration of four additional factors. First, sensitivity analyses using resampling from the distribution of the 11 estimates in those studies suggested that the median might be higher if a study was added or subtracted from the set considered. For example, the elasticities from the 3 studies in the middle of the distribution of those 11 were −0.20, −0.20, and −0.90; if the middle value was removed, the median estimate would be −0.55.”
What they are saying is that taking one or another study out of their list can greatly change the median estimate, so they’re going to randomly drop one study at a time and recalculate the median for the remaining studies. This is an approach in meta-analysis known as the ‘one study removed’ technique (again, it is not stated clearly by the CBO that this is what they are doing), and it is used to see how sensitive the average values are to exclusions. Because their estimates vary so much and there are more negative ones, the exclusion of some studies can greatly increase the magnitude of the median estimate.
My own judgment is that they are correct that their median is overly sensitive to their choice of studies, but that is a reason to bring more studies in rather than to adjust the number upwards by a seemingly arbitrary amount. ‘One study removed’ analysis is used to identify outliers—studies that might be unusual given how much influence they have on their result. As this applies to virtually half their estimates, either the minimum wage literature is so uncertain that it’s hard to draw conclusions, or their sample of it is so skewed that their literature review isn’t helpful.
After using this method as a reason to increase the magnitude of the elasticity, the CBO counterbalances it with three other (equally opaque) reasons to reduce its magnitude, and eventually settle on an elasticity of -0.25. With such a minuscule change it might seem like I’m making much ado about nothing, but they tweak this estimate further and multiply it by 1.5 to account for the effect the minimum wage will have on employment in the long run, ultimately arriving at a value of -0.38. Additionally, in their 2021 update they increase it even further to -0.48 by using the mean instead of the median because they judge that large negative elasticities are more likely than large positive elasticities, which is just another way of repeating what they already did with the ‘one study removed’ analysis. The net effect of all these poorly explained adjustments is to increase the unemployment estimates by hundreds of thousands. Dube himself has noted that more credible, lower estimates of the elasticity have emerged since 2019, so the CBO’s tweaks go in the wrong direction. ↩
This may cause some confusion as the value of the elasticity of immigration seems similar to the Neumark-Shirley minimum wage elasticity. Remember that the two numbers are actually very different as one is a response to a minimum price and the other is a response to a supply change. We need the figures to tease out what they imply about the demand curve as a whole ↩
